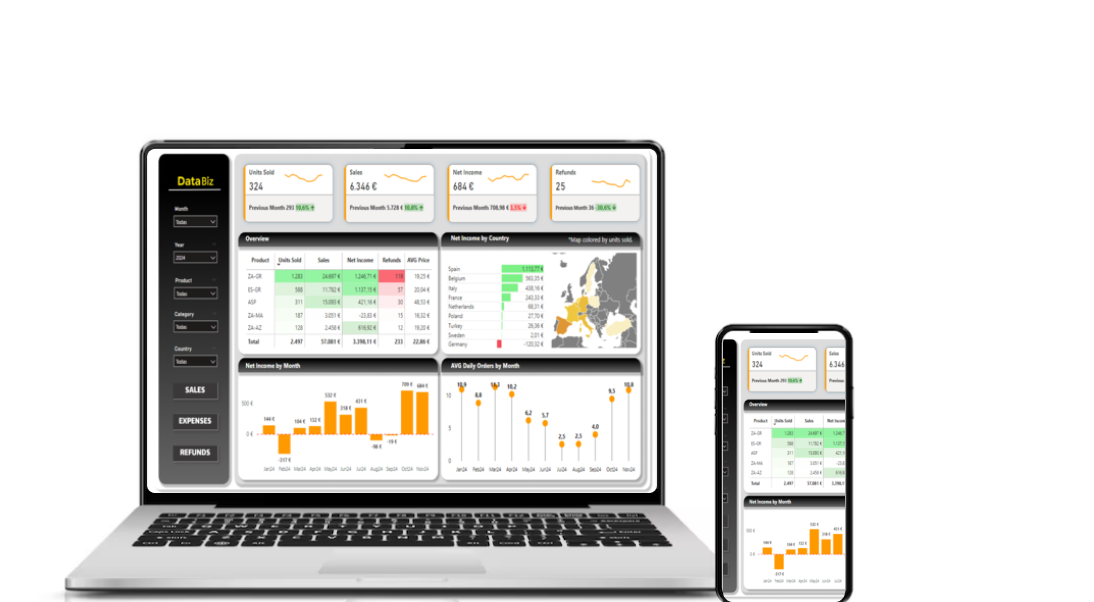
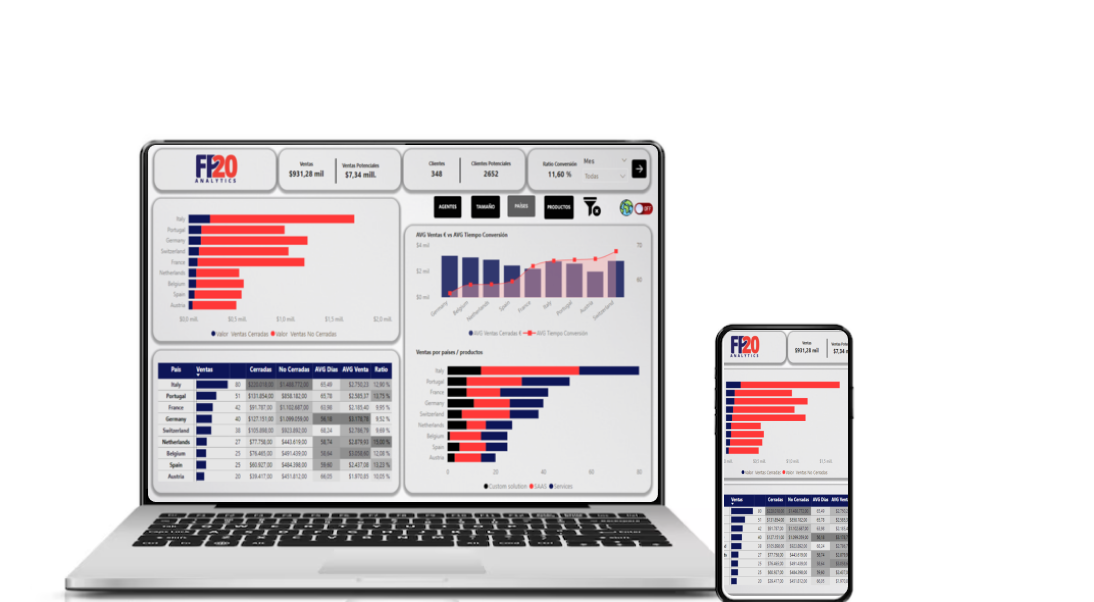
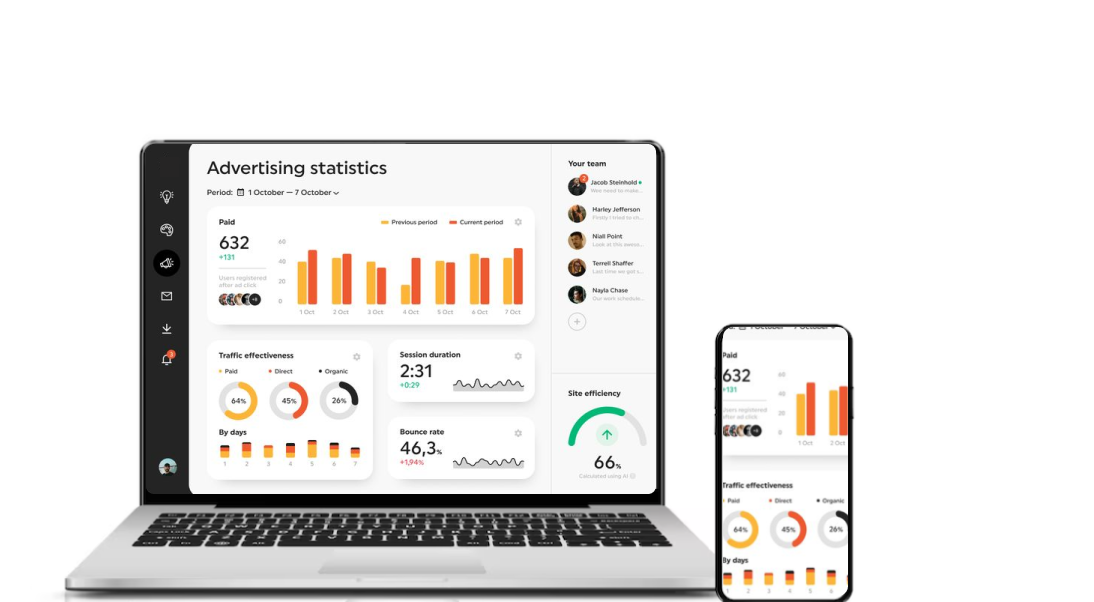
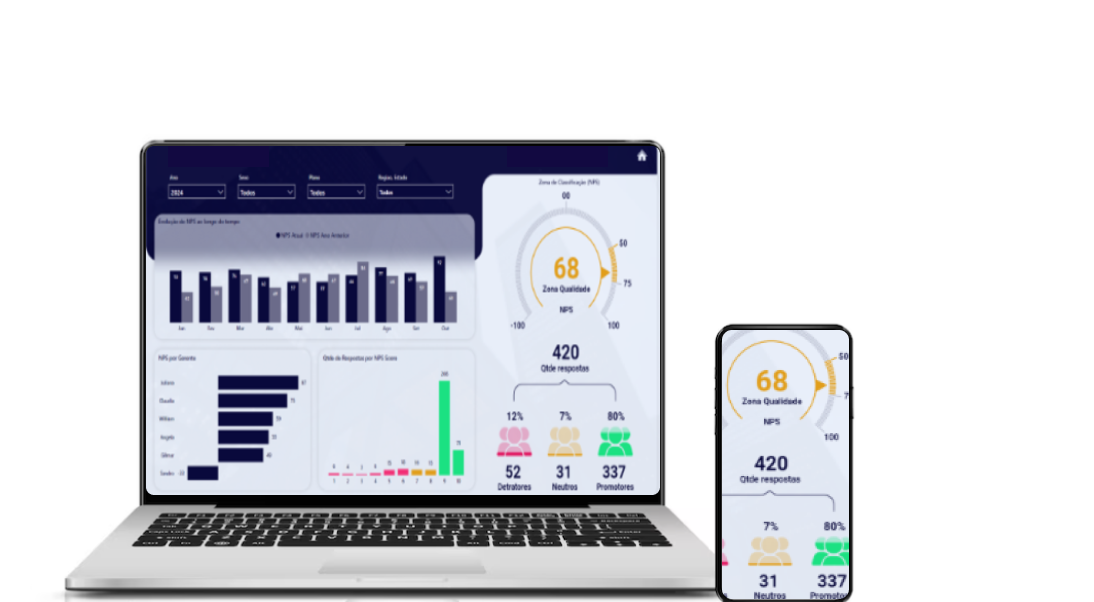
Tailor-made Business Intelligence: dashboards for your business
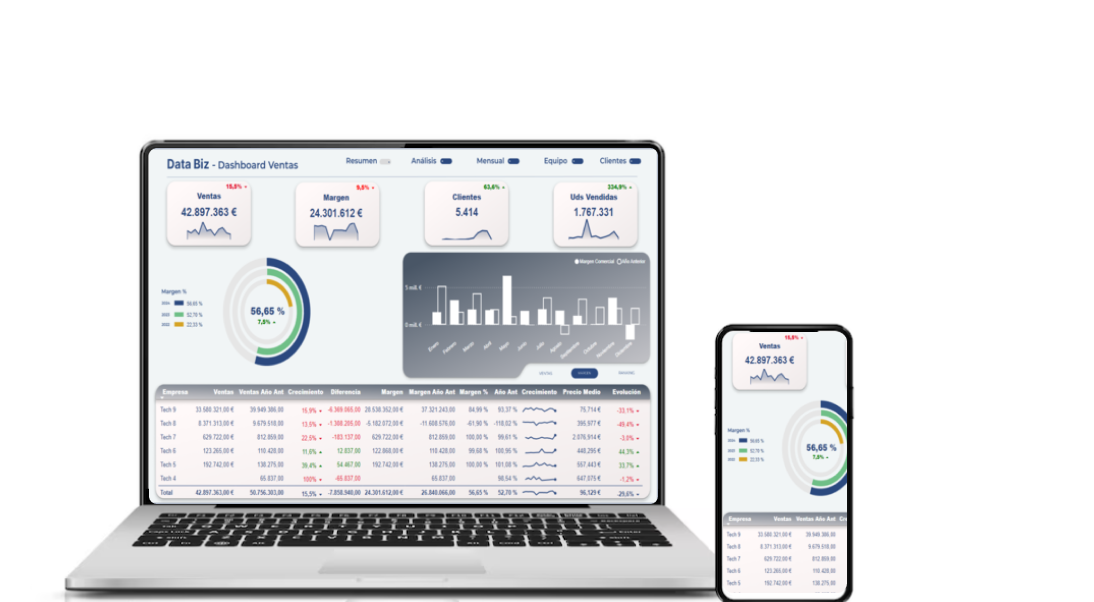
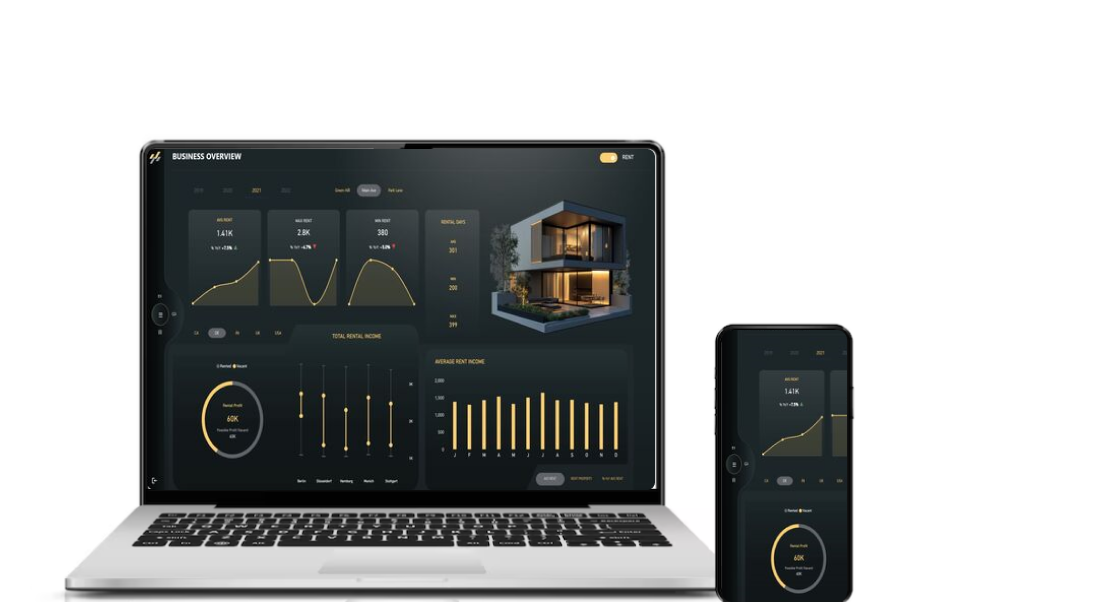
Business intelligence (BI) uses your company’s data to build solutions for mobile and desktop, letting you stay in control, make efficient decisions and grow your business.
Marketing and sales · Power BI · illustrative exampleLive
Sales
128 k€
▲ 12% vs prev. month
Margin
32 %
▲ 3 pts vs prev. month
Orders
1.284
▲ 8% vs prev. month
Traffic and sales
⋯
RevenueTrend
Acquisition channel
⋯
Web 45%Marketplace 30%Store 25%
Performance by channel
⋯
Channel
Spend
CPC
Conversion
Google Ads
3.240 €
0,52 €
4,8 %
Meta Ads
2.180 €
0,78 €
3,1 %
LinkedIn Ads
1.050 €
1,35 €
1,6 %
Email
0 €
—
6,4 %
Benefits
What you get with a Business Intelligence dashboard
Clear, always up-to-date reports so you know what’s happening in your business and decide with data, not intuition.
Business analysis
Interactive reports that give you a clear, real-time view of what is happening in your company, such as opportunities or deviations that are hard to spot.
Centralise your data in a single report
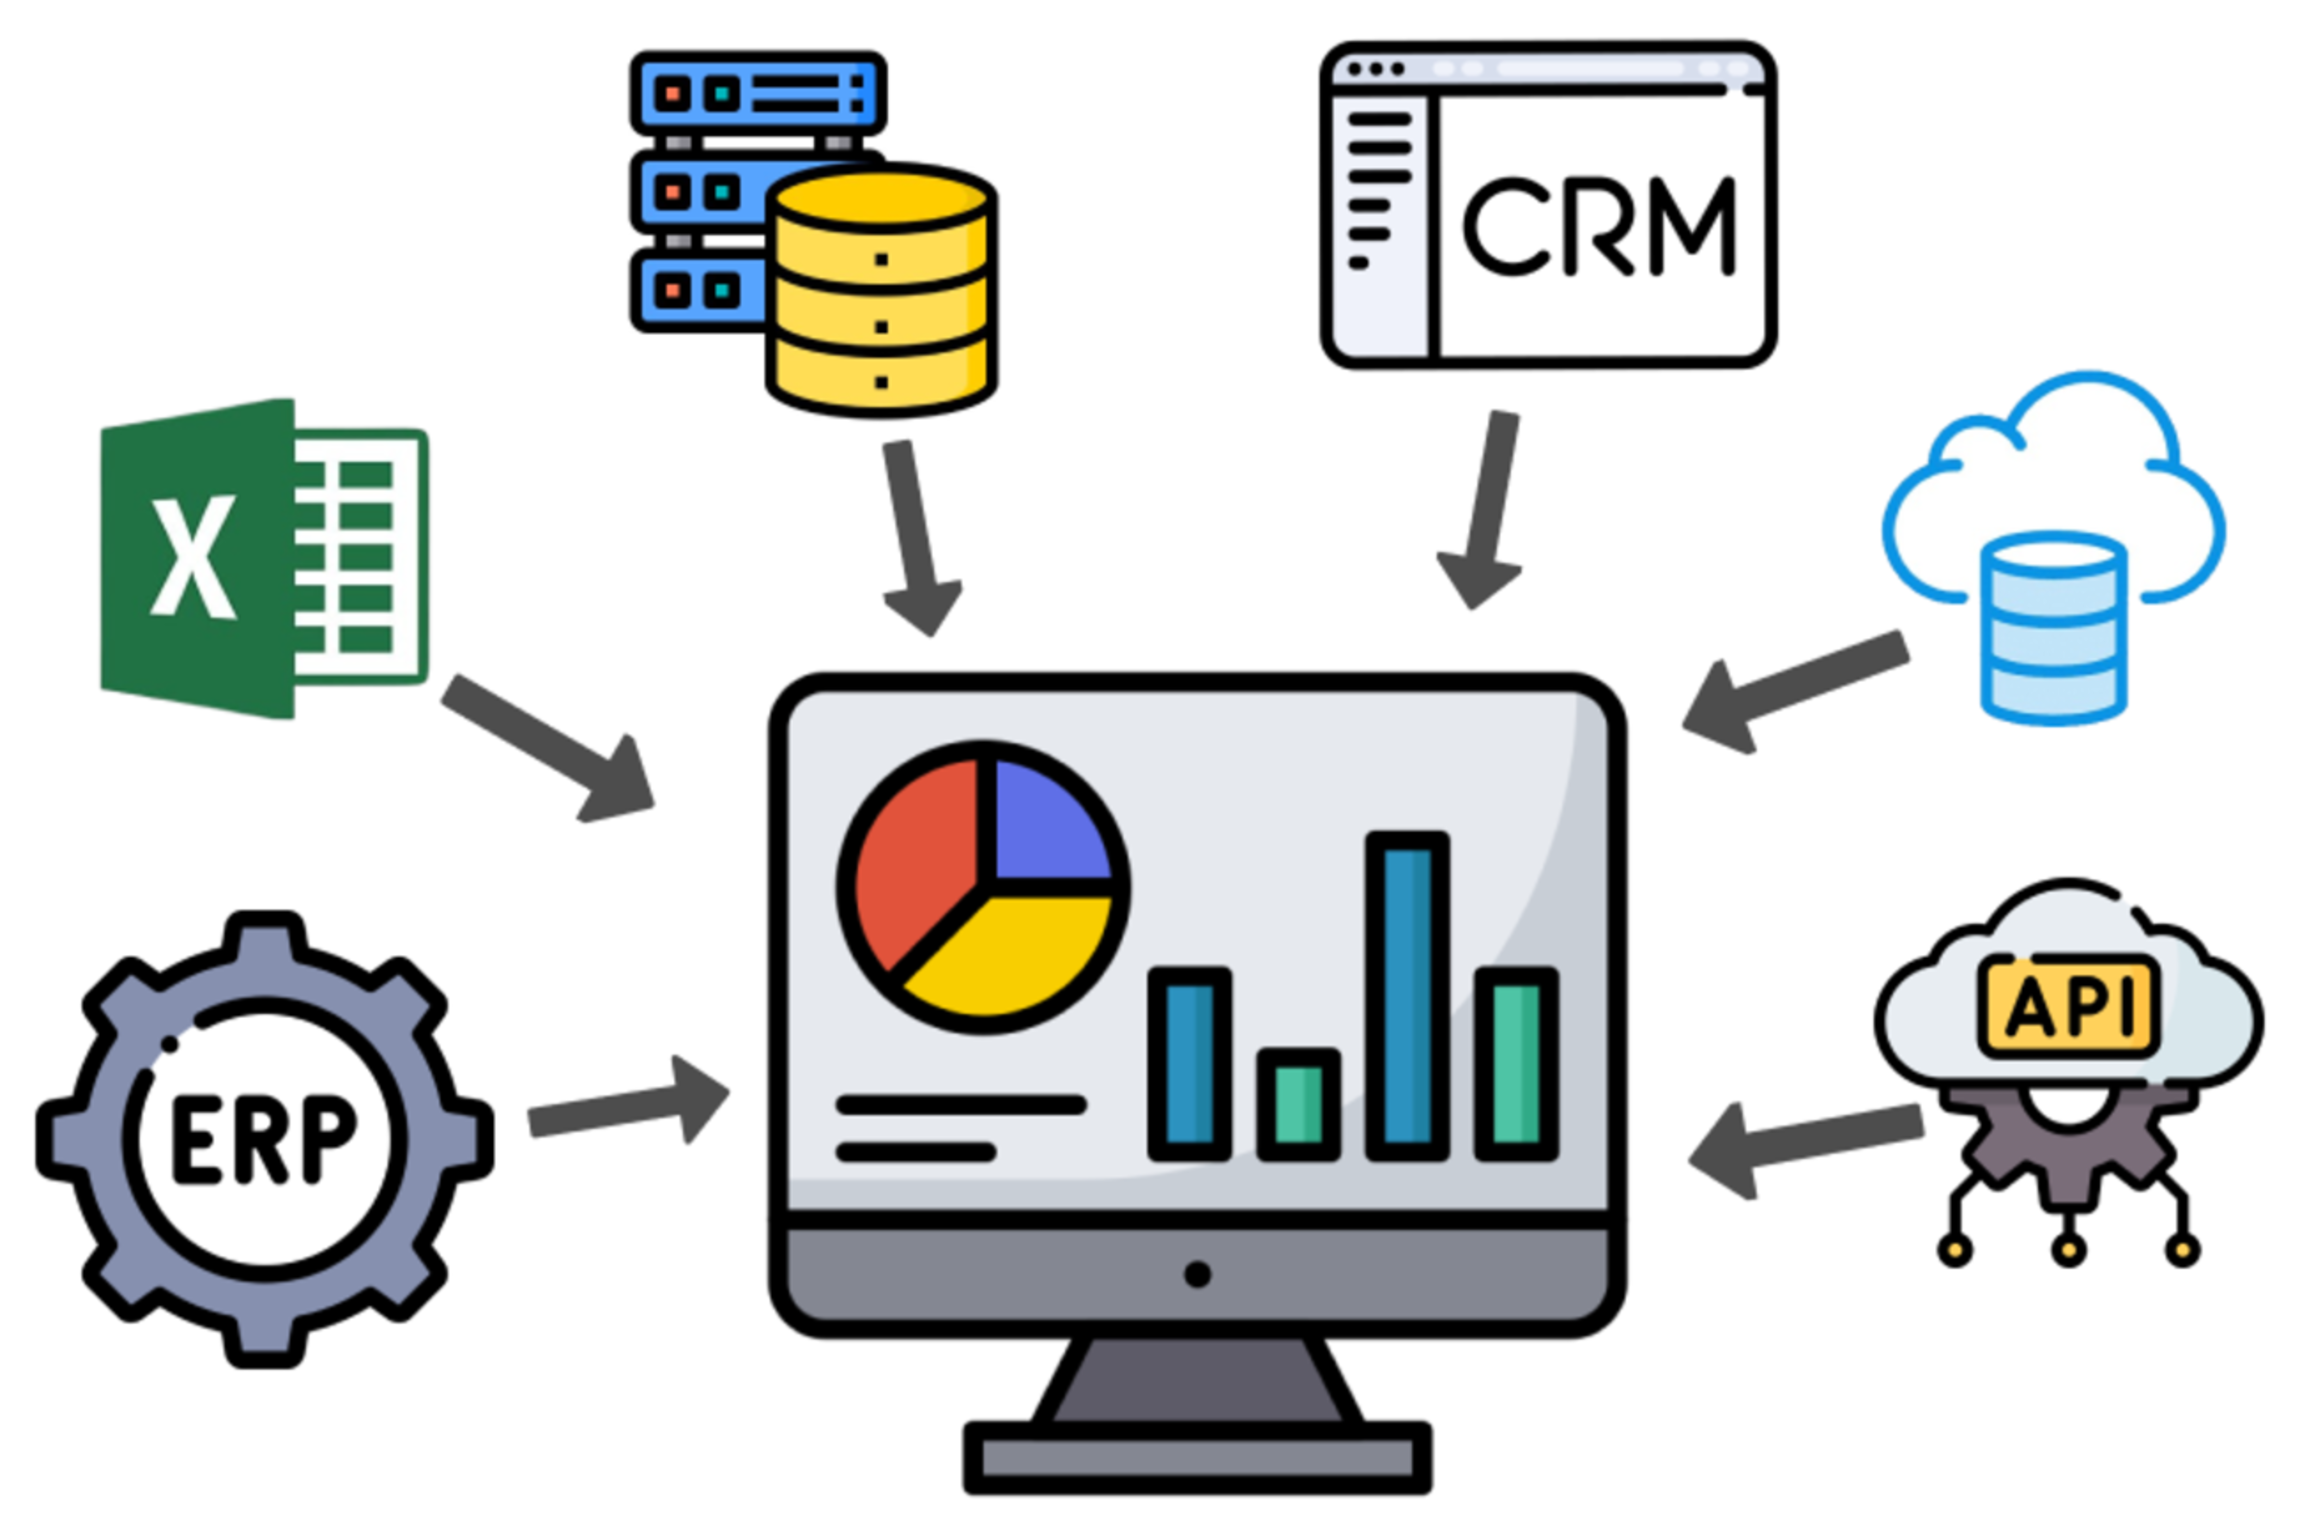
We unify data from all your sources in a dynamic, up-to-date report.
Process automation
Increase productivity and improve processes automatically, reducing time and
costs.
Better decision-making
Information becomes power and confidence in decision-making.
Companies of any size
Whether you are an SME or a large company, you can get key business signals and optimise your performance.
Information automation
We digitise, organise and automate your information to make it easier to access and
process.
Data organisation
Our comprehensive data management services help you organise, maintain and
analyse your data productively.
Custom solutions
We adapt to your business and reflect your brand’s corporate image, while using the
latest design techniques.
How we work
From your data to a dashboard you can use, in three steps
1
We analyse your data
We review where your data comes from (sales, expenses, accounting, Amazon…) and what decisions you want to make with it.
2
We design your dashboard
We build interactive reports with your brand’s look and feel that look great on mobile and desktop.
3
We put it into action
We connect your data sources so the report updates itself, and we help you get the most out of it.
Demo video · Accounting (P&L) report
Demos
Request your demo!
Explore our demos and discover how this tool turns data into smart decisions. Request the one you like best and we’ll help you create a custom solution for your business.